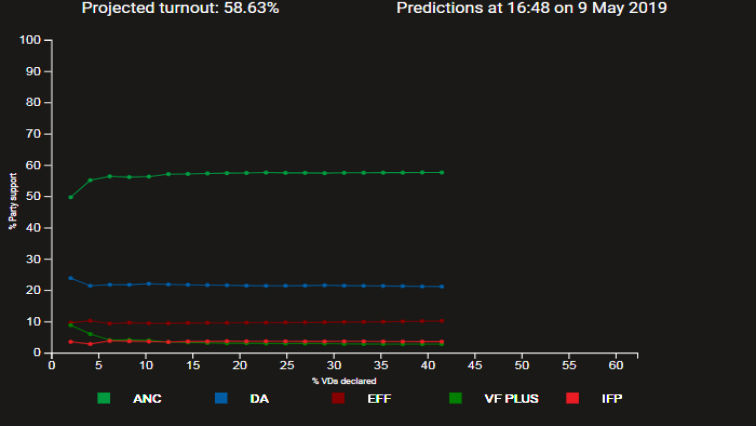
Predicting election outcomes is usually left up to pollsters who conduct surveys as close to the election as possible. These results reflect sentiment and are used to represent the outcome. Another way of predicting results is to look at historical patterns of support for each party and project those trends forward to the election date. This method relies on the past pattern of support continuing to the time of the election.

Projecting the National trend to May 8 (see graphic 1, above) indicates that the ANC is set to get 56 percent of the votes. By comparison the CSIR who have made predictions based on past patterns and insights from the votes already cast, indicate the ANC will get 57% of votes.
Likewise the projections and the CSIR model indicate the EFF will get 10% of the votes cast.
However the two methods differ when making predictions for the DA.
Projecting past trends suggest that the DA will get 25% of the vote. The CSIR on the other hand shows the DA receiving only 21% of votes. Because the CSIR model leverages insight from the votes already cast, it is almost certainly a better predictor.
However a comparison between the two figures highlights the extent to which the DA has deviated from its past trajectory of an ever-increasing share of votes. The difference between the two figures highlights the extent to which the DA has deviated from the improvement that had defined the party since its establishment. Because the ANC has been on a declining trajectory since 2004, its current loss of vote share was largely expected. It is the deviation between the DA’s expected growth and its declining share of votes that marks the DA as the big loser in 2019.
By examining provincial projections of vote share it is possible to gain further insight into how support patterns are changing.
On Graphic 2 (below) the projections are again compared to the CSIR predictions (marked by the circles). The graphic shows how the ANC slightly surpassed expectations just as often as it failed to meet them.
On the other hand the DA performed worse than expected in all provinces other than the Northern Cape – where its share is spot-on. The DA’s performance (when compared to the CSIR predictions) was particularly poor in Gauteng and the Western Cape, and slightly worse than expected in North West, Limpopo and the Eastern Cape.

Projecting EFF support is problematic as that party has participated in only two elections. The CSIR projections indicate that the EFF’s rapid growth in Limpopo between 2014 and 2016 has not been maintained. This said the EFF did perform slightly better than expected in KwaZulu-Natal.
Despite the reliability of the CSIR projections, only half the votes have been counted so far and corrections may be made for smaller parties like the EFF.


