A new study shows that the importance of party loyalty in voter decision-making is declining, while socio-economic factors climb the ladder and social grants don’t hold the sway you think they do.
What really drives our voting decisions in South Africa? Now well into our third decade of democracy, everyone, from seasoned political commentators to “armchair critics”, seems to have a take, but there is scarce academic and statistical data to test these against until now.
A limited regional 2016 study by the Centre for Social Development in Africa (CSDA) had previously shown that while 90% of survey respondents were aware of their democratic right to healthcare, food and water, education, housing, and social security (such as our targeted social grant system), as many as 33% were unsure that these rights would be protected should another party come to power.
In this previous study, researchers from the CSDA were able to demonstrate that social grants did indeed have some influence on how poor people voted, but more significant predictors were issues like party identification, party loyalty, ratings of government performance, and perceptions of corruption.
Here already, there were strong indicators that a widely touted assumption – that, in crude terms, grants guarantee votes – needed further exploration.
Breaking new ground
On 2 October 2018, the CSDA published the results of an ambitious national study, the first of three waves of data collection and analysis that will run until 2019. This newer and nationally representative research was an opportunity to dig deeper into the links between social grants and voting, along with testing the sticking power of matters like party loyalty over time and in light of 2017’s revelations about corruption in certain governmental spheres. If party loyalty is of declining importance, researchers surmised that matters like the creation and implementation of sound socio-economic policies would climb the preference factor ranks.
With this in mind, the research was aimed at exploring to what extent government performance in delivering these rights, as well as perceptions of corruption and governance, were likely to influence voter preferences as we approach the 2019 elections. This included putting controversial topics – like race, gender, and social grants receipt – under the microscope.
Study design
The study reports descriptive findings from data collected in a nationwide survey, and robust statistical modelling to extract correlations and pinpoint predictors of voter behaviour.
- Researchers spoke to over 3400 people, from a random and nationally representative sample.
- There was an equal percentage of male and female respondents.
- Most respondents were aged between 18 and 34 years (49%), with 43% aged 35-59 years, while 7% were older than 60 years.
- 75% of respondents were black, 11% coloured, 11% white and 3% Indian/Asian.
- Most respondents were working (49%) as opposed to not working (19%) or unemployed (32%). Respondents in the sample were largely poor and fell into the lower and middle-income bands.
- In terms of education 50% of respondents have Grade 12 as the highest level of education; 28% secondary school; 4% primary school. A further 4% of respondents have an artisan’s certificate, 6% have a technikon diploma, and only 4% have a university degree.
Big picture outcomes
The report highlights five ‘headline’ findings:
- ANC support declining: Support for the ANC continues to decline, sitting at 53% of total respondents (where 11% of the total said they would not vote or did not know who they would vote for), but the biggest opposition parties are unlikely to be able to achieve majorities, opening the door to coalition governance going forward.
- The seismic shifts have begun: The data shows that ‘trust in the party’ emerged as the main reason for voting for a particular political party (37%). Second ranked was that the party brought freedom and democracy (35%), and the likelihood that a party will bring a better life was a close third (32%).
- Fear factor: Although 86% of respondents said they did not think that receipt of a social grant affected their voting preferences, this was not the case for social grant beneficiaries. A quarter (25%) of social grant beneficiaries indicated that fears that they could lose their social grants if they voted for another party were influential in their voting choices. See more below.
- Predictive factors: The post-collection analysis found perceptions of governance, socio-economic rights protection, and corruption to be significant predictive factors. Plus, factors such as age, race, education, and gender were all shown to be statistically significant in the analysis.
- Women lead: Women respondents are less likely to vote for the ANC in the next election compared to their male counterparts.
In addition, researchers extract many further insights: Most survey respondents reported they intended to vote for the ANC (53%) in 2019, followed by the Democratic Alliance (DA) (22%) and the Economic Freedom Fighters (EFF) (6%). Just 5% of respondents said that they would not vote. When asked which people consider to be more important – democratic rights or socio-economic well-being – the majority (44, 6%) said socio-economic well-being.
Predictably, those who valued socio-economic rights (such as a lack of jobs, income, and poor housing delivery) were less likely to vote for the governing party, perhaps because they perceive a weakening in delivery of these rights under the ANC.
Social grants in the crosshairs
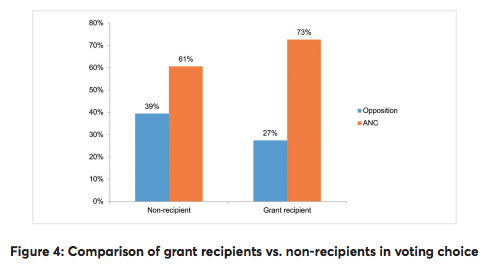
Almost 24% of respondents received a grant from the government. Of the respondents who received a grant, 73% said that they would vote ANC. Meanwhile 61% of respondents who did not receive a grant said they would vote ANC. In post-analysis statistical modelling though, receipt of a government grant was not found to be statistically significant in predicting voters’ party choice; the fear of losing a grant should a new party come to power was significant. Those who held this fear are more likely to vote ANC in the 2019 general election.
Of all respondents, 14, 6% said that one of the reasons they voted for a particular party was because they “receive a government grant and are afraid that another party will not give [them] a grant”. Of the respondents who receive a grant from government, one in four said this was their reason for their party choice.
The implication is that the critical motivating factor here is not the provision of social grants, but more the fear of their removal.
As mentioned, this study is just the first of three waves of research planned up until October 2019. Whether these observed trends will hold over the next year remains to be seen, but the research has already yielded stats and figures that stand up to scrutiny, and give us a clearer picture of the mind-set of South African voters – a mind-set far more nuanced than anecdotal evidence and commentary typically give voters credit for. – By *Professor Leila Patel
*Professor Leila Patel is SA Research Chair in Welfare and Social Development and Director at the Centre for Social Development in Africa (CSDA), based at the University of Johannesburg. Yolanda Sadie, Professor of Politics, University of Johannesburg. Megan Bryer, Researcher, Centre for Social Development in Africa, University of Johannesburg.
About the Centre for Social Development in Africa:
The Centre for Social Development in Africa (CSDA) is a research centre based at the University of Johannesburg. Established in 2003, the centre is dedicated to basic, applied and strategic research in social development and developmental welfare. At the CSDA, we aim to positively influence development issues in the Southern African region by contributing to debates on social policy, improvements in service delivery and the expansion of knowledge through cutting-edge research