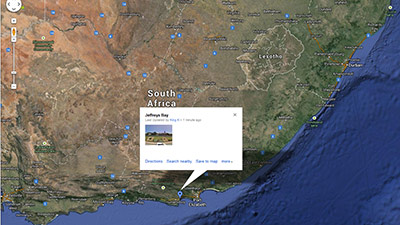
Little did Jospeh Avent Jeffrey, who was the senior partner in the Jeffrey and Glendinnings firm, know when he opened a beach store in the St. Francis Bay in 1849, that the place would be known as Jeffrey’s Bay more than 150 years on.
Just over 27 000 people live in the town, with the Whites and Black Africans occupying more than 70% of the town’s population and Coloureds third in the perking order.
Afrikaans is the most spoken language followed by Xhosa and English.
The town, which falls under the Cacadu district municipality, is one of the most loved tourist destinations because of its surfing opportunities and the Blue Flag beach. It falls under the Kouga Local Municipality.
Kouga means a place of plenty. It is famous for its abundant seashells, great seafood and calamari.
Town: Jeffrey’s Bay
City: Port Elizabeth
Municipality: Kouga Local Municpality / Cacadu District Municipality
Population: 27 107
Kouga Local Municipality
Jeffreys Bay began as a trading post in 1849. Proclaimed a town in 1926, it achieved municipal status in 1968. In 1575 the Portuguese navigator, Manuel Pestrello, named St Francis Bay after the patron saint of sailors. The town was founded by Leighton Hullett in 1959, when the first 51 plots were surveyed. Today there are over 3 200 erven. Municipal status was conferred on the town on 1 January 1993.
Kouga means ‘place of plenty’ (Khoisan). An alternative interpretation is ‘place of the hippopotamus’
Humansdorp was named after Matthys Human, on whose farm, Rheeboksfontein, the town was founded in 1849. The name Patensie is said to be from a Hottentot word meaning a resting place for cattle.
Kouga means ‘place of plenty’ (Khoisan). An alternative interpretation is ‘place of the hippopotamus’.
Employment by Industry (% of Labour force)
Agriculture …………………………………………………2,707 (5.6%)
Mining / quarrying ……………………………………………57 (0.1%)
Manufacturing ……………………………………………2,623 (5.4%)
Electricity / gas / water supply …………………………243 (0.5%)
Construction ………………………………………………2,498 (5.2%)
Wholesale / retail trade ………………………………..2,000 (4.1%)
Transport / storage / communication ………………..266 (0.5%)
Financial / insurance / real estate …………………..3,511 (4.9%)
Community / social / personal services …………..2,924 (6.0%)
Private households / other ………………………….8,405 (11.7%)
Population by Monthly Income (incl Social Grants) (% of population)
R 204 801 or more…………………………………………..140 (0.2%)
R 102 401 – R 204 800…………………………………..318 (0.4%)
R 51 201 – R 102 400………………………………………84 (0.1%)
R 25 601 – R 51 200………………………………………572 (0.8%)
R 12 801 – R 25 600……………………………………1,344 (1.9%)
R 6 401 – R 12 800……………………………………..3,553 (5.0%)
R 3 201 – R 6 400……………………………………….5,232 (7.3%)
R 1 601 – R 3 200……………………………………….5,315 (7.4%)
R 801 – R 1 600………………………………………11,898 (16.6%)
R 401 – R 800…………………………………………….3,350 (4.7%)
R 1 – R 400………………………………………………..1,833 (2.6%)
No income…………………………………………..
– By


